See the skin concerns behind customer demand.
Oyster maps rising concerns across thousands of skin analyses to help you plan stock and formulations.
Deployed and measured across 17+ countries











Understand concerns across your market.
Aggregate skin-concern data by region, skin type and season, without ever exposing a single customer's identity.
See which concerns are rising, by city and by season.
Track how demand shifts across your regions, so your shelves match what skin actually needs next quarter.
Explore the intelligence layer ↗Live signal
Across 300,000 scans, hyperpigmentation and barrier damage are the fastest-rising concerns in your markets.
See your market in context.
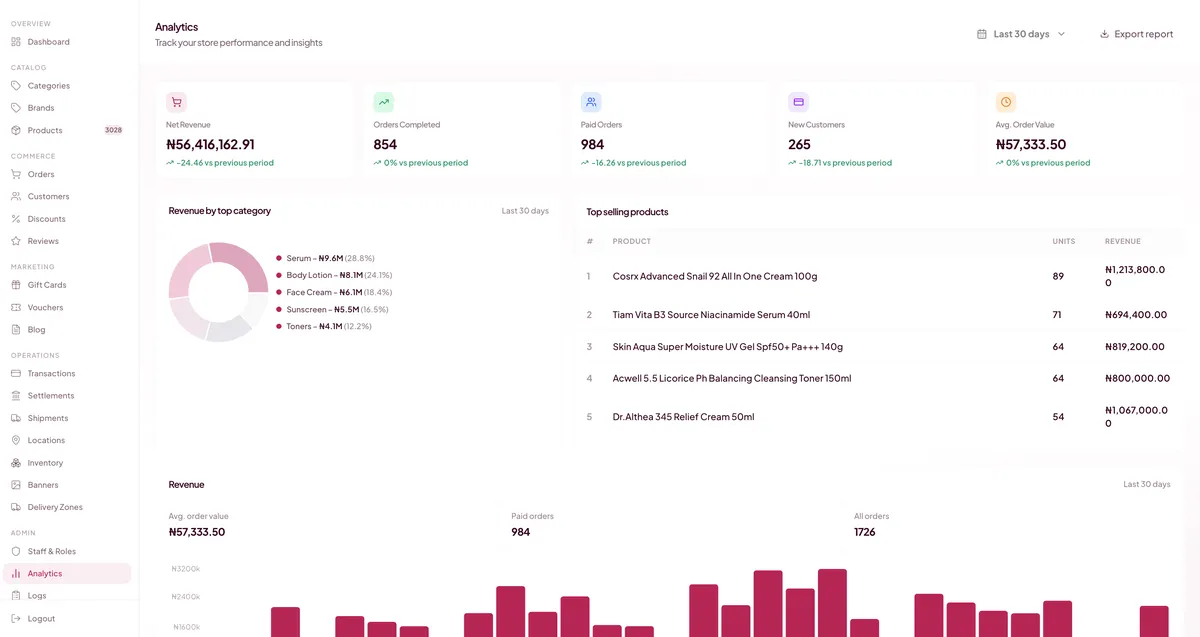
Illustrative analytics walkthrough. The screenshots on this page show saved product views, not live market data.
Begin with activity. Review scan activity alongside the business questions your team needs to answer. Keep the selected period and location consistent when comparing results.
Follow the sales view. The retail analytics screenshot shows revenue by category, top-selling products and order measures. Use this view to understand what is selling before deciding what to investigate next.
Bring your questions. Ask for a live walkthrough of the concern and market views available to your account. The retail sales screenshot alone does not establish a concern-to-purchase relationship.
Use skin-concern data to plan customer outreach, stock and campaigns.
Get your deployment plan ↗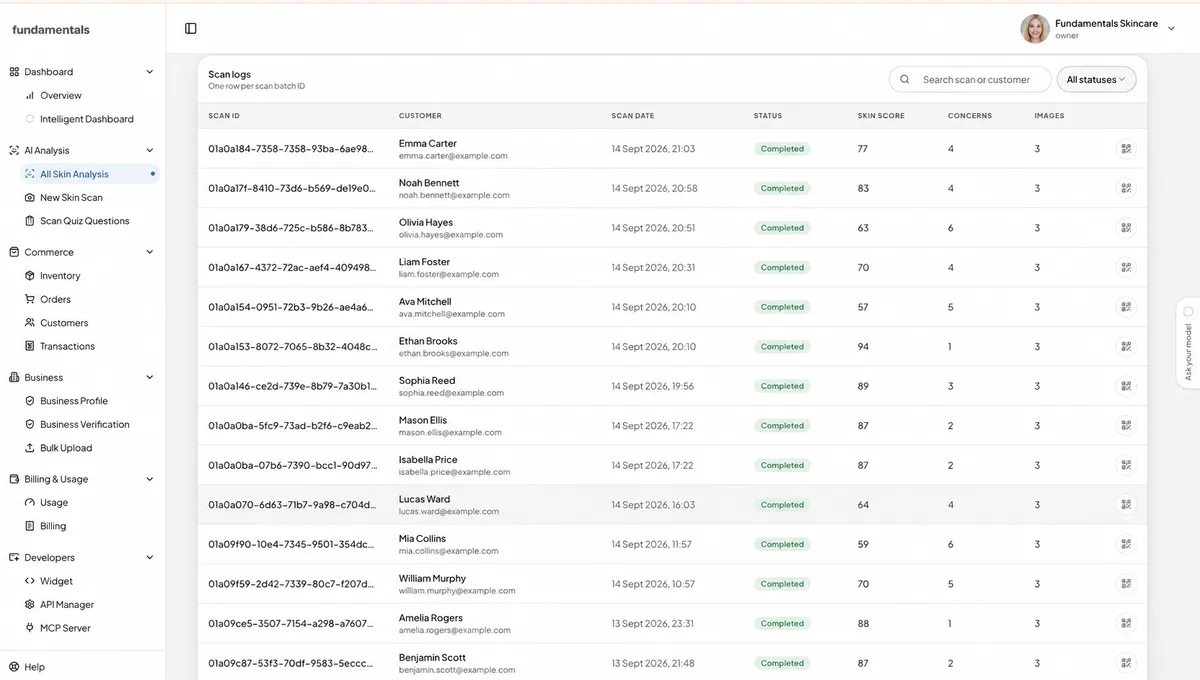
Which products convert against which concerns.
Compare your bestsellers with the concerns driving purchases.
The customers you are underserving.
Find skin concerns your current range does not address, then plan what to stock or formulate.
Private by design.
Every insight is aggregated. You see the market, never the individual. POPIA, NDPR and GDPR compliant.
How the intelligence is built.
01
Every customer scans
Fifteen markers measured, in seconds.
02
Oyster aggregates
Signals combined across region, type and season.
03
You act ahead of demand
Stock, formulate and campaign against what is rising.
Stop guessing what your market wants. Measure it.
Thirty minutes, a live scan, your data. See your first insights this week.